Agency Uptime Reports: 10 Monthly Items, Including Certificate Expiry
By Nick Phillips, Founder
Agency Uptime Reports: 10 Monthly Items, Including Certificate Expiry

A good agency uptime report goes out monthly and covers uptime percentage, a timestamped incident log, MTTR and MTTA, a response-time summary, and certificate expiry warnings. Check sites at a cadence suited to their criticality. We built Otterwatch as a certificate-first, low-noise option, so agencies can send this report without drowning in alerts.
TL;DR:
- Calculate uptime after excluding scheduled maintenance, and show the reporting dates and time zone; pair MTTR with MTTA to separate repair speed from acknowledgment speed.
- Choose availability for stores, booking sites, and lead generation pages; sites built around content or applications need response time reporting.
- Brochure or low traffic sites can be checked every five minutes; confirm failures with a retry and probes from multiple regions to limit false alarms.
- For each domain, list the certificate’s expiry date and days remaining, note chain problems or unexpected changes, and record who renewed it and when.
- A 99.9% target over 28 days allows 40.3 minutes of downtime; when the error budget nears exhaustion, pause risky changes and prioritize fixes.
Table of Contents
- What should a client-ready uptime report include?
- How do you calculate uptime, nines, MTTR and MTTA?
- Which SSL and certificate checks belong in the report?
- How often should you check, and from where?
- How should you present reports and status pages to clients?
- How do SLOs, SLIs and error budgets fit into a client report?
- How do you write incident summaries clients actually read?
- Why a calm, certificate-first approach works for small teams
- How does Otterwatch map to this checklist?
- FAQ
- Sources
What should a client-ready uptime report include?
Think of the report as a one-page answer to “Was my site okay this month?” Here is the checklist we use as a template:
- Period covered: exact start and end dates, with the time zone.
- Uptime percentage: one number for the month, calculated after excluding scheduled maintenance.
- Incident count: how many separate outages or degradations occurred.
- Incident timelines: start time, end time, and a one-line cause for each.
- MTTR and MTTA: average time to resolve and average time to acknowledge.
- Longest downtime: the single worst incident.
- Response-time summary: average and slowest checks, in plain seconds.
- Certificate expiry notes: days left on each client certificate, plus anything renewed.
- Scheduled maintenance: listed separately and excluded from downtime.
- Recommended next steps: two or three concrete actions, with owners.
Explain each item the way you would to a client over coffee. “Uptime” becomes “the share of the month your site was reachable.” “MTTR” becomes “how long, on average, it took us to fix a problem once it started.” Attach the raw incident log for clients who want detail, and keep the summary page quick to read.
For incident lines, stay blameless and factual. Something like: “The site was unreachable after a hosting provider restart. Service was restored, and we have added another check location to confirm future events faster.”
Pro Tip: Put a one-sentence verdict at the top of every report (“No customer-facing downtime this month”) so busy clients get the answer before the numbers.
How do you calculate uptime, nines, MTTR and MTTA?
Uptime percentage is simple: (total minutes in the period minus minutes of downtime) divided by total minutes, times 100. Downtime reduces the uptime percentage, and the amount depends on the length of the reporting period. The observability guidance on reliability explains how availability targets translate into allowed downtime. The “nines” framework turns those percentages into allowed downtime, and observability guidance on reliability lays out the standard conversion table. If you want the math worked through, our post on the nines of uptime covers it in minutes.

MTTR is the average time from incident start to resolution. MTTA is the average time from the first alert to a human acknowledging it. Agencies include both because they show how your team behaves, not just how the server behaved. A site can go down because of a host outage you did not cause, yet a fast MTTA still proves you were watching.
Which metric to lead with depends on the client:
- Stores, booking sites and lead-gen pages care most about availability.
- Content-heavy or app-like sites often care more about response time.
Sample language: “Because your checkout is your revenue path, we lead with availability and track page speed as a secondary measure.” We cover why these deserve separate targets in our uptime versus response time post.
Also remember that chasing perfection has a cost. As the SRE book notes, pursuing 100% uptime has diminishing returns, so choosing a sensible target and stating it clearly is the practical move.
Which SSL and certificate checks belong in the report?
Certificate problems are the most preventable outage you will ever report on, and the least visible until it is too late. An expired certificate shows visitors a browser warning, and to a client that looks identical to the site being down.
Report these certificate facts for every client domain:
- Expiry date and days remaining: shown as a simple number so a client can scan it.
- Chain issues: a missing intermediate certificate can break some devices but not others.
- Changed certificates: a new certificate appearing unexpectedly deserves a note.
- Renewal actions taken: what we renewed, and when.
Phrase warnings calmly and with a next step: “The certificate for shop.example.com is nearing expiry. Renewal is scheduled, and no action is needed from you.” If something is closer, say who is doing what by when.
This is a valuable line in the report. It is easy to check and can help you demonstrate proactive work. Our comparison of SSL certificate monitoring tools explains which features are worth prioritizing.
How often should you check, and from where?
Check frequency is a trade-off. Faster checks catch short outages sooner, but they raise cost and the chance of noise. Sensible starting points:
- Critical sites (stores, payment pages): use a faster check cadence.
- Typical business sites: choose a regular check cadence that balances timely detection with alert noise. Our simple uptime monitoring guide walks through a setup.
- Brochure or low-traffic sites: every 5 minutes is plenty.
- Confirm before alerting: require a failed retry from a second moment before calling something an outage.
- Probe from more than one region: one failed check in one location is often a network blip, not a real outage.
Multi-region checks matter for the report too. If you tell a client “the site was confirmed down from multiple locations,” the number carries weight. If you report every single failed ping, the client sees a scary figure that does not match their experience.
To cut false alerts before they reach a report, use retries, short confirmation windows and staggered checks. Our write-up on stopping false alerts goes deeper on this.
Pro Tip: Add one sentence to the report explaining your confirmation rules, such as “an outage counts only after failed checks from separate regions confirm it.” It heads off disputes about the numbers.
How should you present reports and status pages to clients?
Deliver a monthly digest, and send immediate alerts only for high-severity outages and certificate expiries inside a critical window. This keeps clients informed without training them to ignore your messages.
A layout that works:
- Executive summary: one sentence, the verdict.
- Metrics snapshot: uptime, incidents, MTTR, MTTA, response time.
- Incident log: each event with timeline and customer impact.
- Actions taken: what we did and what we changed.
- Next steps: what is planned for the coming month.
Status pages deserve a decision per client. A private page suits clients who want reassurance without publicity. A public page suits SaaS or customer-facing brands where visitors check status themselves. Soft white-labeling, meaning your agency’s colors and a client-friendly tone rather than a vendor’s logo, makes the page feel like part of your service.
Link the report into the client portal if you have one, so history lives in one place. If you charge for SLA-style guarantees or uptime reporting, tracking that effort matters too. Agency time-tracking advice from Roadbase is a useful read on keeping quotes honest.
How do SLOs, SLIs and error budgets fit into a client report?
These three terms sound heavy, but the ideas are small. An SLI is a measurement of user-facing behavior, such as the share of successful requests. An SLO is the target you set for that measurement. An error budget is the downtime you can “spend” before missing the target. As this SRECon talk on service level objectives explains, SLOs let teams compute error budgets and trigger alerts when the budget burns too fast.
Say you promise 99.9% over 28 days. The observability guidance on reliability gives an allowed downtime budget of 40.3 minutes for that target and window.
| SLO | Window | Allowed downtime | Used so far | Remaining |
|---|---|---|---|---|
| 99.9% | 28 days | 40.3 minutes | Not shown | Not shown |
Showing the remaining budget in the report turns an abstract promise into a gauge clients understand. It also gives you a policy. Google’s guidance on error budgets frames them as a way to balance reliability against feature work, rather than treating every outage as a failure. When the budget is nearly gone, recommend pausing risky changes and prioritizing fixes.
For small teams, a short primer on service level objectives is good further reading.
How do you write incident summaries clients actually read?
Keep the incident narrative to four parts:
- Timeline: when it started, when we noticed, when it was fixed.
- Impact: what visitors experienced, in plain words.
- Mitigation: what we did to restore service.
- Next steps: what changes so it is less likely to recur.
Blameless phrasing keeps things calm: “A scheduled update on the hosting side caused a brief interruption” works better than naming a person or a vendor in anger. Skip stack traces and error codes in the main body. Offer a technical appendix for clients with in-house developers, and attach it as a separate page so the summary stays clean.
Why a calm, certificate-first approach works for small teams
In my view, most agency “outages” that cause real client panic are not dramatic. They are an expired certificate on a Friday evening, or a flood of alerts that trained everyone to stop reading them. Putting certificate expiry first removes the most preventable failures, and a low-noise setup means that when we do get a message, we treat it as real. Calm monitoring protects attention, and attention is what keeps clients from leaving.
— Nick Phillips
How does Otterwatch map to this checklist?
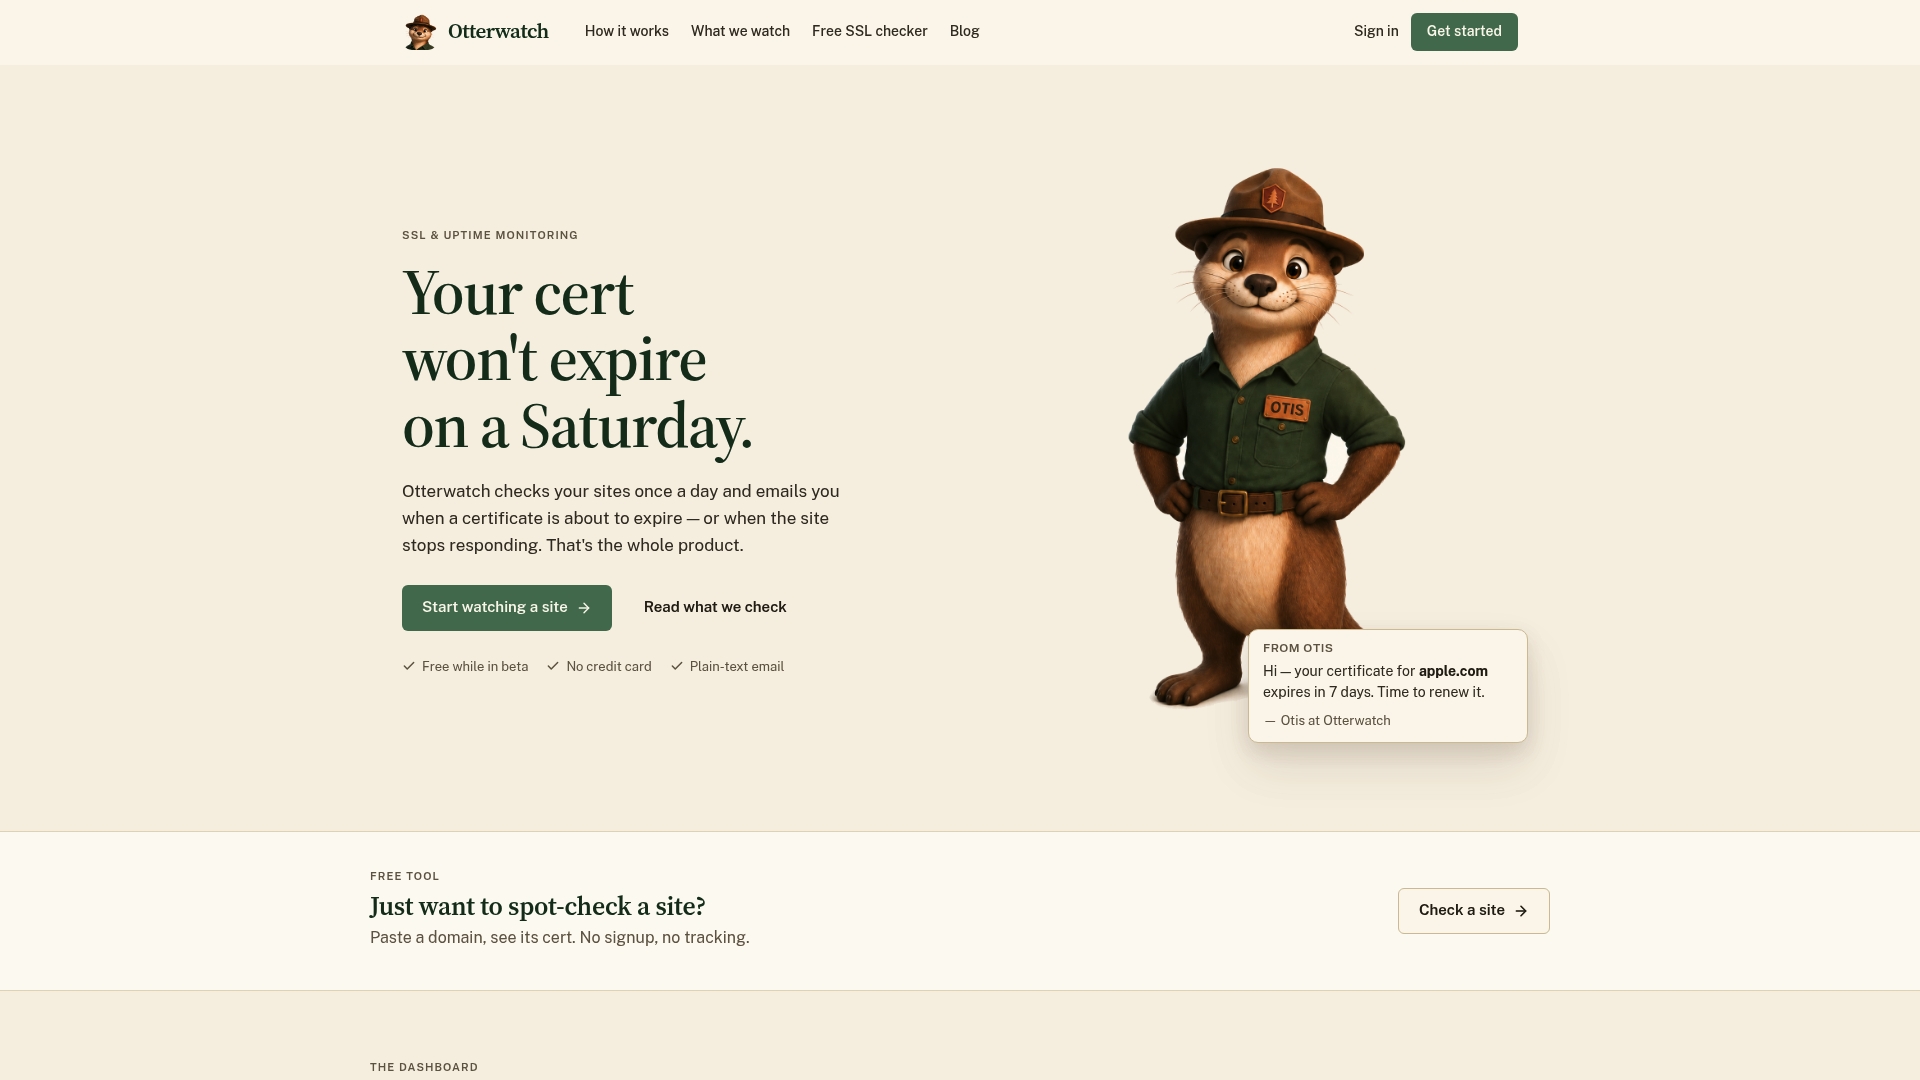
We built Otterwatch around calm website monitoring. We watch your SSL certificates and warn you well before they expire, while quietly checking that your sites are up. Otis, our park ranger otter, sends a plain, friendly heads up by email instead of a wall of red alarms. The free plan lets you try it on a few client domains before committing, and our Pro plan is $15 per month for agencies that need more.
Not sure where a client stands right now? Run a domain through our free SSL certificate checker for a plain-language answer, then see the pricing page to start monitoring.
FAQ
What is an uptime report?
An uptime report is a summary of how often a website or service was available during a set period. It usually includes the uptime percentage, a log of incidents, and response-time or certificate notes. Agencies send it to clients, typically monthly, as proof of service.
Is 98% uptime good?
For most business sites, no. Most agencies aim for 99.9% or better, though the right target depends on the site, and diminishing returns apply as you approach 100%.
What is considered a good uptime?
A common target is 99.9%, though the downtime allowance depends on the length of the reporting period. Formal agreements often use that figure, as seen in published service level agreements. Pick a target that matches the client’s business needs and state it clearly.
What is the best tool for monitoring uptime?
It depends on your team. For small teams and agencies that want fewer alerts and early certificate warnings, we recommend Otterwatch, which checks uptime and SSL expiry together and starts free for five sites.
Sources
Recommended
- Sysadmins’ Runbook: Avoid Token Breaks from Client Certificate Expiry
- Copy Ready Certificate Expiry Calendar for Small Teams
- UptimeRobot vs pingping.io vs TrackSSL vs Certimon vs SSLreminder 2026
- 200 Day Cap Starts March 15, 2026: SSL Renewal Window Tactics for Ops
Catch the next cert expiry before your users do.
Otterwatch checks your SSL certificates daily and emails you 30 days before they expire. Five sites free.
Start watching →