Stop Chasing False Alerts: Small Team Uptime Monitoring That Puts SSL First
By Nick Phillips, Founder
Stop Chasing False Alerts: Small Team Uptime Monitoring That Puts SSL First
Monitoring uptime means running scheduled checks from more than one location, tracking both availability and response time, and getting alerted the moment something fails. To start today, set up an HTTP or API check on a two to five minute interval, wire it to one notification channel, and turn on TLS expiry alerts so a dying certificate doesn’t masquerade as a mystery outage next month.
TL;DR:
- Running checks from three or more geographic regions helps distinguish between a localized network issue and a real service outage.
- Using a combination of HTTP, API, TCP, DNS, and push checks ensures better coverage of different failure modes and reduces false positives.
- Setting alert thresholds based on response time deviations, not just binary status, captures failures that affect user experience without triggering unnecessary alerts.
- Integrating uptime alerts into incident management tools streamlines response, reduces duplicate tickets, and automates possible remediation actions.
- Starting with simple checks every one to two minutes, TLS alerts, and one notification channel provides a reliable baseline before increasing complexity.
Table of Contents
- What Is Uptime Monitoring, Really? The Main Check Types
- Setting Check Intervals, Probe Locations, and Alert Thresholds
- Alerting, Escalation, and Talking to Users During an Incident
- Hosted, Self-Hosted, or Hybrid: Picking Your Monitoring Setup
- The Otterwatch View: Certificates First, Uptime as the Quiet Bonus
- Connecting Uptime Checks to Your Incident Workflow
- Reading Your Uptime Data Without Fooling Yourself
- Where Uptime Monitoring Falls Short
- Locking Down Your Monitoring Setup
- A Pragmatic Baseline That Actually Gets Used
- Try a Calmer Way to Watch Your Sites
- Setup Docs Worth Bookmarking
- Sources
- FAQ
What Is Uptime Monitoring, Really? The Main Check Types
Before you pick a tool, you need to know what you’re actually checking. “Uptime monitoring” gets used as a catch-all, but the checks underneath it verify very different things, and picking the wrong one gives you false confidence.
Here’s the breakdown by what each check actually confirms:
- HTTP(S) checks hit a URL and inspect the status code, verify the TLS handshake completes, and optionally scan the response body for a keyword (“Order Confirmed,” not “Error”). For JavaScript-heavy pages, a synthetic browser check that renders the page is more honest than a raw HTTP request, since a 200 status code can still hide a blank screen.
- API/JSON checks go a layer deeper, validating specific fields inside a JSON payload, not just the HTTP status. A payment API might return 200 while
"status": "degraded"sits buried three levels into the response. These checks also need to handle auth tokens and rate limits without triggering the very throttling you’re trying to avoid. - TCP/ping and port checks confirm basic reachability, useful for a database on port 5432 that has no web interface to poll.
- DNS checks catch name resolution failures, the kind of outage where your server is fine but nobody can find it.
- Cron/push monitors flip the model: instead of you pinging a service, the job pings the monitor to confirm it ran. Silence is the failure signal.
A typical small stack needs at least three of these running at once: an HTTP check on the homepage, an API check on your core endpoint, and a push monitor on your nightly backup job.
Setting Check Intervals, Probe Locations, and Alert Thresholds
Interval choice is a tradeoff between detection speed and noise. A critical payment API justifies a 10 second to 1 minute interval; a marketing site is fine at 5 to 15 minutes. Most everyday web apps land comfortably in the 1 to 5 minute range, which balances early warning against unnecessary load and cost.
Multi-location probing solves a specific problem: telling the difference between “my site is down” and “one data center’s network had a bad five minutes.” Running website checks from multiple geographic locations is described in detail in a practical guide on how to run an AI visibility audit. Running checks from three or more regions means a single-region failure reads as a regional network blip, while a failure across all regions reads as a real outage. Skip this and you’ll get paged for other people’s routing problems more often than your own.
The uptime math matters more once you’re reporting it to a client or a boss. Uptime is simply the percentage of time a service responded correctly over a given period, and that math on downtime allowance is a matter of writing out the percentage a service actually delivered, as documented in standard SLA calculation guides.
The downtime allowance at a glance:
- 99.9% uptime (“three nines”) allows roughly 43 minutes of downtime per month, or about 8.75 hours per year.
- 99.5% uptime allows roughly 3.6 hours of downtime per month, or about 43.8 hours per year, over four times the allowance of three nines.
- 99% uptime allows roughly 7.3 hours of downtime per month, which sounds fine until you realize that’s nearly a full workday.
Binary up/down alerts miss half the picture. A site that returns 200 in 4 seconds instead of its usual 400 milliseconds is failing its users even though no monitor flagged it red. Set a response time baseline from your normal traffic, then alert when the 95th percentile drifts well past it, not just when the server goes fully dark.
Alerting, Escalation, and Talking to Users During an Incident
An alert that nobody sees is just a log entry. The channel you pick should match how fast you need a human to respond.
- Email works for low-urgency, non-time-sensitive alerts, like a slow SSL renewal reminder.
- Slack or Teams fits team-visible incidents where you want context and discussion attached to the alert.
- PagerDuty (or a similar on-call tool) is built for anything that needs a human awake at 3 a.m., with built-in escalation policies.
- Webhooks let you pipe alerts into whatever custom tooling or ChatOps setup your team already runs.
A workable escalation flow looks like this: first alert fires to the primary on-call channel, an acknowledgement window of 5 to 15 minutes follows, and if nobody acknowledges, escalation bumps to a secondary contact or a phone call. Build in a silencing mechanism for planned maintenance, or you’ll train your team to ignore alerts altogether, which defeats the entire point.
Status pages deserve a clear rule: post publicly when the issue affects users, keep it internal when it’s a backend hiccup nobody outside the team will notice. Overposting erodes trust as fast as underposting does.
Pro Tip: Group alerts by root cause before they hit a human. One flaky database connection that trips ten downstream checks should generate one incident, not ten pages. Most modern alerting tools support this kind of deduplication. Turn it on before your team starts muting notifications out of self-defense.
Hosted, Self-Hosted, or Hybrid: Picking Your Monitoring Setup
There’s no universally correct answer here. It comes down to how much operational overhead your team can absorb versus how much control you want over your data.
A hosted approach hands you managed probes across multiple regions with no servers to babysit. Google Cloud Monitoring’s setup is a good example of this model in action: you create an uptime check, configure notification channels, and test the check to trigger an incident, all without provisioning a single box. The tradeoff is less customization and an ongoing subscription cost.
A self-hosted approach trades that convenience for full control. Uptime Kuma runs checks as frequently as every 20 seconds, supports a wide range of check types, and integrates with dozens of notification services, all for the cost of the server it runs on. Upptime takes a different angle, using GitHub Actions to run scheduled checks and publishing a status page straight to GitHub Pages for effectively no hosting cost.
A hybrid setup runs both in parallel, so a hosted service watching your self-hosted monitor gives you a fallback if your own infrastructure goes dark.
Before choosing, run through this checklist:
- What check types do you actually need (HTTP, API, TCP, cron)?
- How many notification integrations does your team already use?
- How much data retention do you need for trend reporting?
- How much ongoing maintenance can you realistically commit to?
Solo maintainers usually do best starting hosted and simple. Small teams often land on hybrid once uptime starts mattering to revenue.
The Otterwatch View: Certificates First, Uptime as the Quiet Bonus
Most uptime tools treat you like a large ops team and bury you in dashboards you’ll never open. Otterwatch does the opposite. It watches your SSL certificates and warns you well before they expire, catching cert-change events along the way, while quietly running reachability checks on your sites at the same time. Certificates come first because an expired certificate takes a site down just as thoroughly as a server crash, and it’s a far more predictable failure to catch early.
A certificate that expires unexpectedly isn’t a server problem. It’s a calendar problem nobody was watching. Catching it three weeks out instead of three hours out is the whole job.
This tool monitors a limited number of domains for free, sending plain, friendly heads up messages instead of a wall of red. That combination of SSL expiry alerts and certificate change detection covers a failure mode that pure uptime tools tend to miss until it’s already too late.
Connecting Uptime Checks to Your Incident Workflow
An uptime check that fires an alert and stops there is only half a monitoring setup. The real value comes from wiring that alert into whatever tool your team already uses to track and resolve incidents.
Most teams route uptime alerts through a webhook into an incident management platform, where the failed check automatically opens a ticket, tags the right on-call engineer, and starts a timeline. That timeline matters later, when you’re writing a postmortem and need to know exactly when the first probe failed versus when a human first acknowledged it. Google Cloud Monitoring’s own quickstart walks through this exact pattern: creating a check, testing it to force a failure, and confirming an incident gets generated before you ever rely on it in production.
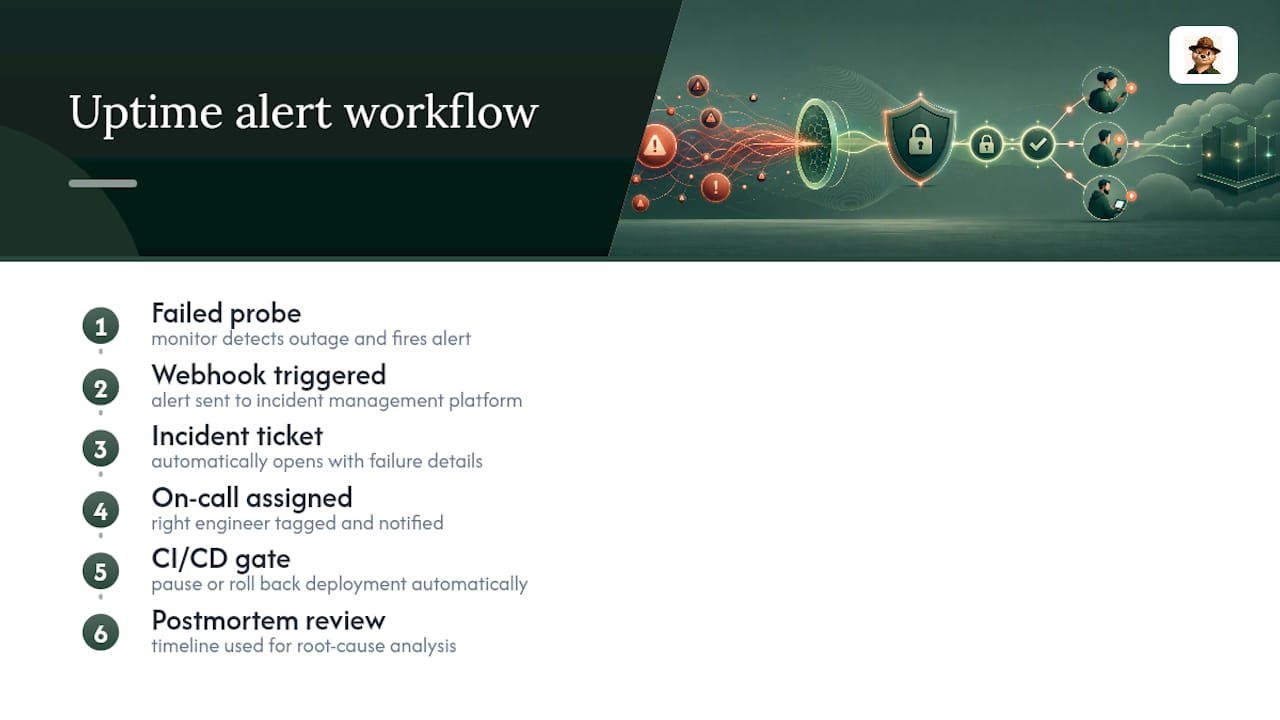
DevOps pipelines benefit from the same integration in a different way. If your uptime monitor can trigger a webhook, you can use that signal to pause a deployment, roll back a release automatically, or block a CI/CD pipeline from promoting a build that’s already causing failures in staging. This turns uptime monitoring from a passive dashboard into an active gate in your release process.
The pattern to avoid is treating uptime alerts and your incident tracker as two separate systems that a human has to manually reconcile. That gap is exactly where response time gets lost, and where the same incident ends up logged twice under two different names.
Reading Your Uptime Data Without Fooling Yourself
A single 99.9% badge on a status page tells you almost nothing about how a service actually behaves. The number that matters more is the shape of the failures underneath it.
Look at whether downtime clusters around specific times, specific deploys, or specific regions. A service that fails in short, frequent blips during business hours has a different root cause than one that fails once a month for two hours during a deploy window. Trend the data weekly, not just per incident, since a service creeping from 200ms to 900ms average response time over a month is a slow-motion failure that a binary up/down check will never flag.
Watch for false positives before you trust a trend line. A single-region network blip that trips one probe location isn’t a real outage, and treating it as one will make your historical uptime numbers look worse than reality, which then skews every decision you make off that data.
Separate planned maintenance from unplanned downtime in your reporting. Blending the two makes your uptime percentage meaningless to anyone trying to judge actual reliability, including future you trying to decide whether last quarter’s infrastructure change actually helped.
Where Uptime Monitoring Falls Short
Uptime monitoring tells you a service responded to a specific request at a specific moment. It does not tell you the service is healthy in every way that matters to a real user.
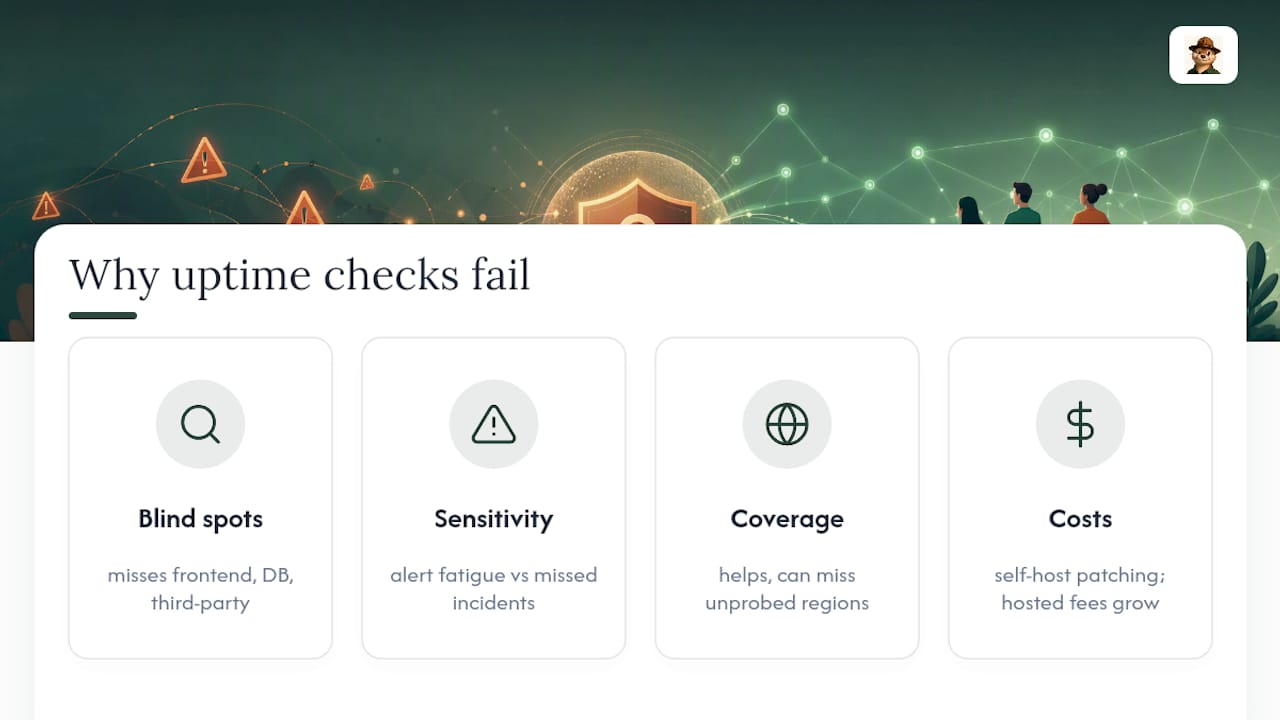
A check can pass while a page loads a broken checkout button, a slow database query silently times out downstream, or a third-party API your app depends on fails without your monitor ever touching it directly. External probes also can’t see everything happening inside your infrastructure, which is why many teams pair uptime checks with internal application performance monitoring rather than relying on external checks alone.
False positives and false negatives both cost you. A monitor that’s too sensitive to transient network blips trains your team to ignore alerts. A monitor that’s too lenient lets a real problem sit for hours before anyone notices. Multi-location checks reduce this risk but don’t eliminate it entirely, since a check that passes from three regions can still miss a failure specific to a fourth region you didn’t think to probe.
Cost and maintenance are real constraints too. Self-hosted tools need someone to patch and babysit them; hosted tools charge more as your check volume grows. Neither approach is free of tradeoffs, and pretending otherwise sets you up for a monitoring gap right when you need coverage most.
Locking Down Your Monitoring Setup
Monitoring infrastructure is itself a target, and an overlooked one. If your uptime checks carry API keys or auth tokens to hit protected endpoints, treat those credentials with the same care as production secrets, not as throwaway test values.
Webhook endpoints that receive alert payloads need validation on the receiving end, or anyone who guesses the URL can fire fake incidents into your workflow, or worse, use it as an entry point to probe your internal tooling. Status pages that show detailed error messages can leak internal architecture details to anyone watching, including which specific service or database is struggling.
If you self-host a monitoring tool, it’s another piece of infrastructure that needs its own patching schedule. A neglected monitoring server is a quiet way to end up with an outdated, exploitable service sitting quietly on your network, watching everything else while nobody watches it.
A Pragmatic Baseline That Actually Gets Used
Start with checks every one to two minutes, TLS expiry alerts running in parallel, one notification channel your team actually checks, and a plain status page. Anything more elaborate before that baseline is solid just adds noise. Skip the alert that fires for every blip; keep only the ones that demand action, or your team will start ignoring all of them.
— Nick Phillips
Try a Calmer Way to Watch Your Sites
Otterwatch is built for exactly the baseline described above: TLS expiry alerts running alongside quiet uptime checks, without the dashboard sprawl of tools designed for large ops teams. It watches your certificates first, catches cert changes as they happen, and checks reachability on the same schedule, so you’re not juggling two separate tools to cover one operational job.
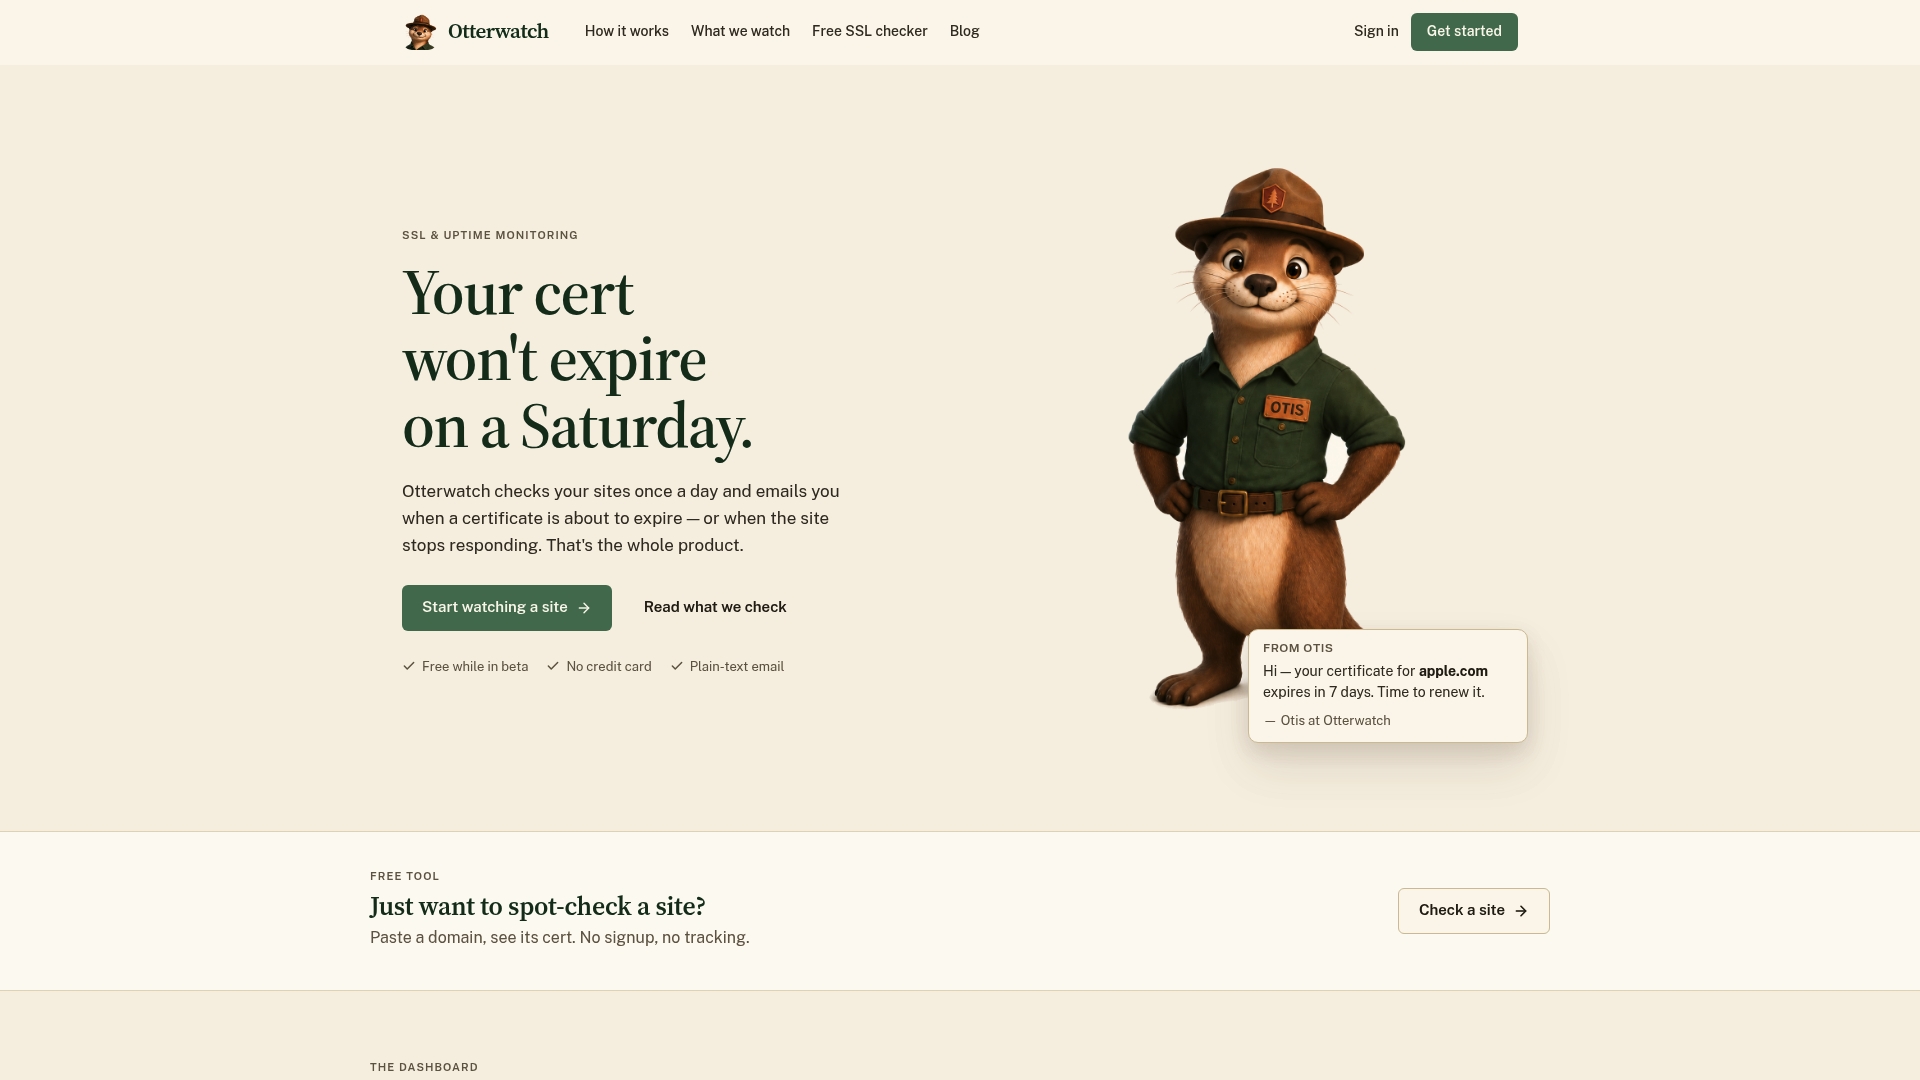
The monitoring service offers free coverage for a limited number of domains, with no credit card required to start. If you want to see it working before committing to anything, run your domain through the free SSL certificate checker first, then set up ongoing monitoring once you see what it catches. For a broader look at how certificate monitoring stacks up against other approaches, the comparison of SSL monitoring tools is worth a read before you commit to any single setup.
Setup Docs Worth Bookmarking
- Google Cloud Monitoring uptime check quickstart: step-by-step setup for checks, notification channels, and incident testing.
- Uptime Kuma: self-hosted monitor with wide check-type support and fast intervals.
- Upptime: GitHub Actions-based checks with a free status page on GitHub Pages.
- Prometheus and Grafana uptime guide: metrics pipeline with PromQL availability calculations.
Sources
- Monitor Linux Server Uptime with Prometheus and Grafana Guide
- Quickstart: Get notified if your app stops responding | Cloud Monitoring | Google Cloud Documentation
- louislam/uptime-kuma
FAQ
How Do You Measure Uptime?
Uptime is measured as the percentage of time a service responds correctly over a set period, typically calculated using tools like Prometheus’s avg_over_time(up[window]) expression or a managed monitoring platform’s built-in reporting.
What Is the Best Uptime Monitoring Service?
There’s no single best option since it depends on your team’s size and budget. Hosted platforms like Google Cloud Monitoring suit teams that want managed multi-region probes with minimal setup, self-hosted tools like Uptime Kuma suit teams that want full control, and a service like Otterwatch fits teams who mainly want SSL expiry coverage with basic uptime checks included.
How Do You Check for Uptime?
Set up an HTTP, API, or TCP check against your service, run it on a regular interval from at least one probe location, and confirm the check both passes under normal conditions and triggers an alert when forced to fail.
How Many Hours Is 99.5% Uptime?
99.5% uptime allows roughly 43.8 hours of downtime per year, or about 3.6 hours per month, which is more than four times the downtime allowed at 99.9% uptime.
Recommended
- SSL certificate monitoring tools, honestly compared
- UptimeRobot vs pingping.io vs TrackSSL vs Certimon vs SSLreminder 2026
- SSL Expiry Notification Setup: A Practical Guide
- How to Avoid SSL Expiration Warnings: 2026 Guide
Catch the next cert expiry before your users do.
Otterwatch checks your SSL certificates daily and emails you 30 days before they expire. Five sites free.
Start watching →