52.6 Minutes for 99.99%: Nines of Uptime Explained for Engineers
By Nick Phillips, Founder
52.6 Minutes for 99.99%: Nines of Uptime Explained for Engineers
“Nines” is shorthand for how many 9s appear in your uptime percentage. Three nines means 99.9% uptime, a level of uptime often used by many systems. Four nines (99.99%) reduces downtime to a few minutes a year, and five nines (99.999%) leaves only a very short amount of downtime yearly. Most teams land on three or four nines because five nines demands automated failover and near instant response that only a handful of systems truly justify.
TL;DR:
- Achieving five nines uptime requires active-active multi-region setups, rapid failover, and MTTR under a minute, which only a few systems can justify.
- Moving from 99.9% to 99.99% uptime reduces downtime by about 90%, with each additional nine exponentially decreasing the total outage time.
- Monitoring intervals set a lower limit on detectable outages, so short failures may go unnoticed if checks are too infrequent or sometimes get concealed by false positives.
- Setting realistic uptime targets should consider the true cost of incidents, like a few minutes of downtime per month, compared to the cost of implementing higher availability practices.
- Prioritizing fast detection and response, rather than just increasing redundancy, typically yields more outage reduction for less cost when aiming for higher nines.
Table of Contents
- Nines of Uptime, Converted to Actual Downtime
- How to Calculate Your Actual Uptime Percentage
- Why Your Reported Uptime Number Might Be Lying to You
- Setting a Realistic Uptime Target With Error Budgets
- A Practical Checklist for Climbing the Nines
- Where Otterwatch Fits Into the Uptime Picture
- Chasing Five Nines Is Usually the Wrong Fight
- Get Certificate and Uptime Monitoring Without the Dashboard Overload
- Sources
- FAQ
Nines of Uptime, Converted to Actual Downtime
The percentage is the easy part. What actually matters is what that percentage costs you in dead air, and the jump between each level is bigger than it looks on paper. Going from 99% to 99.9% doesn’t shave off a little downtime, it cuts it by roughly 90%, and every step after that repeats the pattern.
Here’s the breakdown across the availability levels most infrastructure teams actually work with:
The article lists typical uptime percentages and indicates that downtime decreases significantly as uptime percentage increases, with higher nines leading to exponentially less downtime.
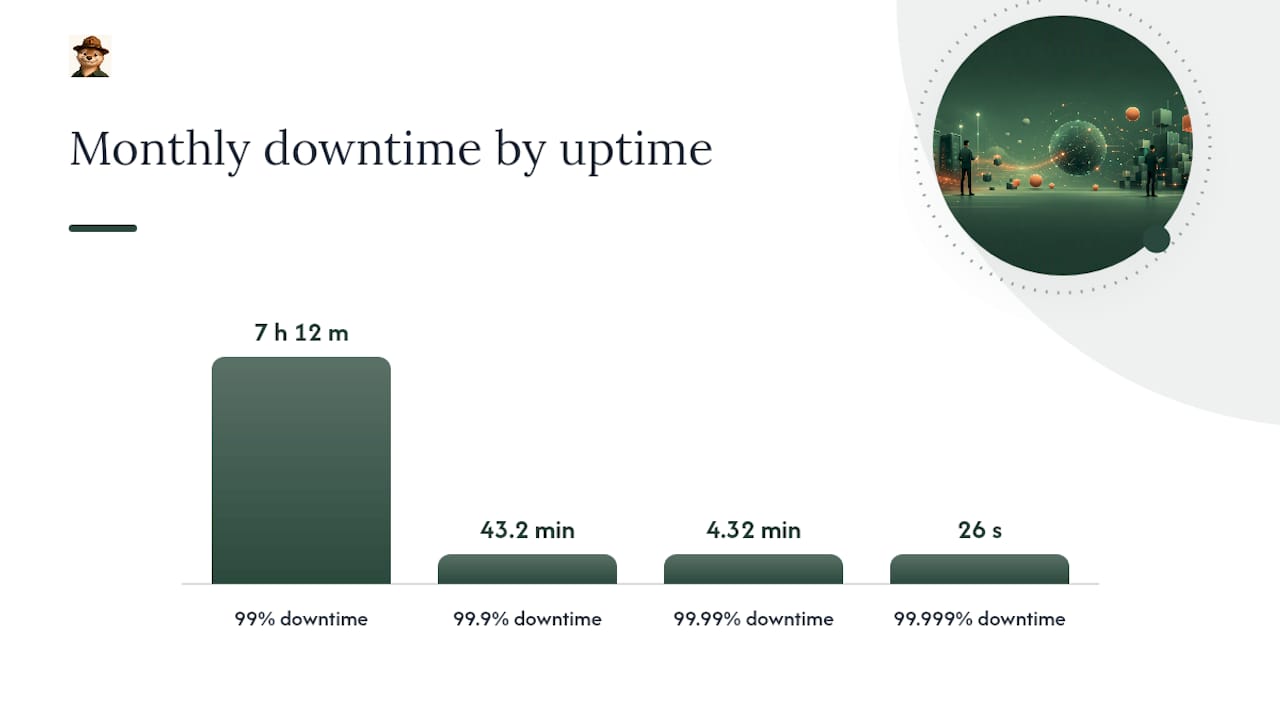
These figures assume continuous 24/7 operation and a 30-day month, which is the standard convention most SLA and uptime calculators use. If your provider measures against a calendar month instead, your numbers will shift slightly, which is why two calculators can both be “correct” and still disagree by a few seconds. Reference tables like IBM’s documentation on the 9s are worth bookmarking specifically because rounding conventions vary enough to matter at the 99.999% level, where you’re arguing over single-digit seconds.
How to Calculate Your Actual Uptime Percentage
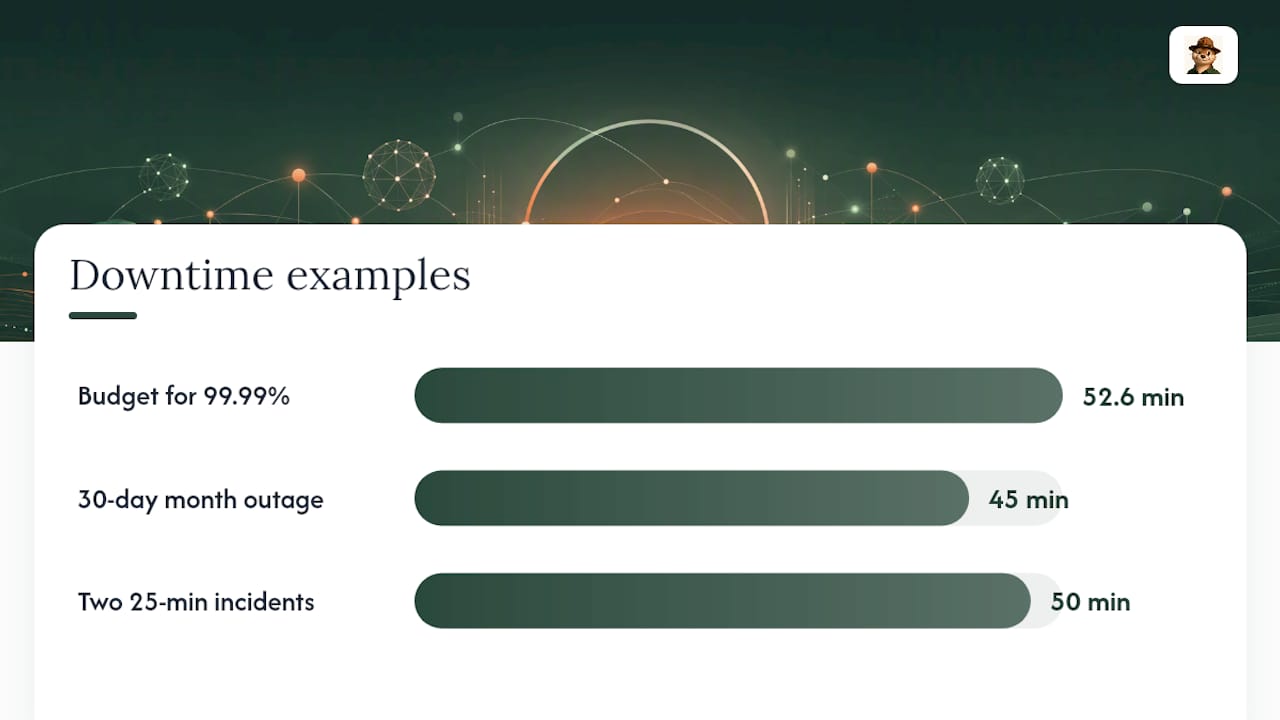
The core formula is simple: (Total time − Downtime) / Total time × 100. If your service was down 45 minutes in a 30-day month, that’s 45 minutes out of 43,200 total minutes, giving you 99.896% uptime, just short of three nines.
There’s a second formula worth knowing, especially if you’re modeling hardware or a specific component rather than a whole service:
- MTBF / (MTBF + MTTR) calculates availability from Mean Time Between Failures and Mean Time To Repair. This is the formula most incident-management frameworks use because it separates how often things break from how fast you fix them, which matters when you’re deciding whether to invest in prevention or response.
- Reverse the math to plan a target. If you want 99.99% over a year (8,760 hours), you’re budgeting for 52.6 minutes of downtime total. Divide that across your expected incident count to see if it’s realistic. Two incidents at 25 minutes each already blow the budget.
- Check-count method vs incident-sum method produce different answers. Counting failed monitor pings out of total pings tends to overestimate downtime if checks run frequently during a single outage, while summing actual incident durations from your logs is more accurate, according to uptime calculation guides that compare both approaches. Use incident-sum whenever you have real timestamps.
Why Your Reported Uptime Number Might Be Lying to You
Uptime numbers look precise. They rarely are.
- Detection interval sets a hard floor. If your monitor checks every 60 seconds, you mathematically cannot detect an outage shorter than that, and short blips simply vanish from your data, a point uptime calculator research makes explicit.
- The watermelon effect is when a dashboard shows green on the outside while the service is red on the inside. A basic ping to your homepage can succeed even while checkout is throwing errors for every user, which is why reliability engineering guidance pushes teams toward request-level correctness checks, not just reachability pings.
- Planned maintenance handling changes the number dramatically. A provider that excludes scheduled maintenance windows from its uptime math can report 99.99% while users experienced a two-hour outage they simply didn’t count, a distinction availability documentation recommends disclosing explicitly rather than burying in fine print.
- Incident aggregation and clock drift matter more than people expect. If your monitoring server’s clock is off by even a few seconds relative to your production servers, short outages can be double counted or missed entirely across log boundaries.
If you want an honest number, decide upfront whether you’re counting planned maintenance, and compute both figures.
Setting a Realistic Uptime Target With Error Budgets
Google’s SRE model gives this a name: the error budget.
Spend it on deploys, experiments, or unexpected failures, whichever comes first. SRE error budget frameworks recommend a simple operational policy built around that number:
- If you’ve burned less than half the budget, ship normally.
- If you’ve burned 75% or more, slow down releases and prioritize stability work.
- If the budget hits zero, freeze non-critical releases until the next window resets.
Three nines is usually enough for internal tools, marketing sites, and most B2B SaaS products where a short outage is annoying, not catastrophic. Reach for four nines when you’re processing payments or running customer-facing infrastructure at scale. Five nines belongs to systems where downtime has safety or regulatory consequences, since analysis of uptime economics suggests each additional nine costs roughly ten times more than the one before it in engineering, tooling, and operational overhead.
Pro Tip: Before committing to a higher SLO, calculate what a single bad deploy costs against your error budget. A 30-second traffic pause during a release can consume most of a five-nines monthly allowance in one shot, which is exactly why teams at that level lean on canary and blue-green deployments instead of standard rolling releases.
A Practical Checklist for Climbing the Nines
Each level of availability demands a specific, escalating set of practices. Skipping straight to five-nines tactics without the fundamentals underneath just adds cost without adding reliability.
- For 99.9%: Set up basic redundancy (a second server or availability zone), automated health checks, uptime monitoring with alerting, and an on-call rotation that actually gets acknowledged.
- For 99.99%: Add automated failover instead of manual intervention, spread infrastructure across multiple availability zones or regions, and adopt zero-downtime deployment patterns so releases stop being a risk event.
- For 99.999%: Run active-active architecture across multiple regions, engineer sub-second failover, practice chaos engineering to find failure modes before customers do, and drive Mean Time To Repair down to under a minute.
- Track the metrics that predict your nines, not just the nines themselves: MTTR trends, failover completion time, and database replication lag are leading indicators that tell you where you’ll land before the monthly report does.
Where Otterwatch Fits Into the Uptime Picture
Otterwatch approaches monitoring from a different angle than most uptime tools. Certificates come first, because an expired SSL certificate takes your site down just as thoroughly as a server crash, and it’s a far more preventable kind of outage. Reachability checks run alongside certificate monitoring, so you get a straightforward uptime signal without a dashboard full of noise.
For teams building out their monitoring stack, a few practical reads worth bookmarking:
- How to monitor uptime without drowning in false alerts
- A comparison of SSL certificate monitoring tools
- API uptime monitoring built around detection intervals
Chasing Five Nines Is Usually the Wrong Fight
A five-minute outage you catch and fix in ninety seconds barely dents your error budget. The same outage sitting undetected for twenty minutes because nobody was watching does real damage, regardless of how many nines are printed on your architecture diagram.
I’ve seen the instinct to buy more redundancy before fixing the alerting pipeline, and it’s backwards. Fast, boring detection beats expensive, elaborate infrastructure that fails silently. Align your SLO with what a customer actually loses when you’re down, not with what looks impressive in a sales deck.
— Nick Phillips
Get Certificate and Uptime Monitoring Without the Dashboard Overload
Most uptime tools bury small teams in dashboards built for enterprise ops departments. Otterwatch skips that entirely: it watches your SSL certificates so they never expire silently, and checks that your sites are reachable at the same time, without a wall of red alerts for every minor blip.

The free tier covers a limited number of sites with core certificate and uptime monitoring included. If you want to see where your own site stands right now, run it through the free SSL certificate checker in about thirty seconds. When you’re ready for ongoing monitoring instead of a one-time check, set up your account at Otterwatch and let Otis handle the watching.
Sources
FAQ
What does 99.999% uptime mean?
Reaching it consistently requires active-active multi-region architecture, automated sub-second failover, and Mean Time To Repair measured in seconds rather than minutes.
Does planned maintenance count against my uptime percentage?
It depends on how you define your measurement. Many providers exclude scheduled maintenance windows from reported uptime, which can make the number look better than what users actually experienced, so it’s worth calculating both figures and disclosing which one you’re quoting.
Recommended
- Stop Chasing False Alerts: Small Team Uptime Monitoring That Puts SSL First
- Low Noise Certificate First API Uptime Monitoring for Small Teams
- SSL certificate monitoring tools, honestly compared
- What actually happens when your SSL certificate expires
Catch the next cert expiry before your users do.
Otterwatch checks your SSL certificates daily and emails you 30 days before they expire. Five sites free.
Start watching →